The Challenge
Research teams produce great thinking — but spend most of their time on the manual research process, not the insight
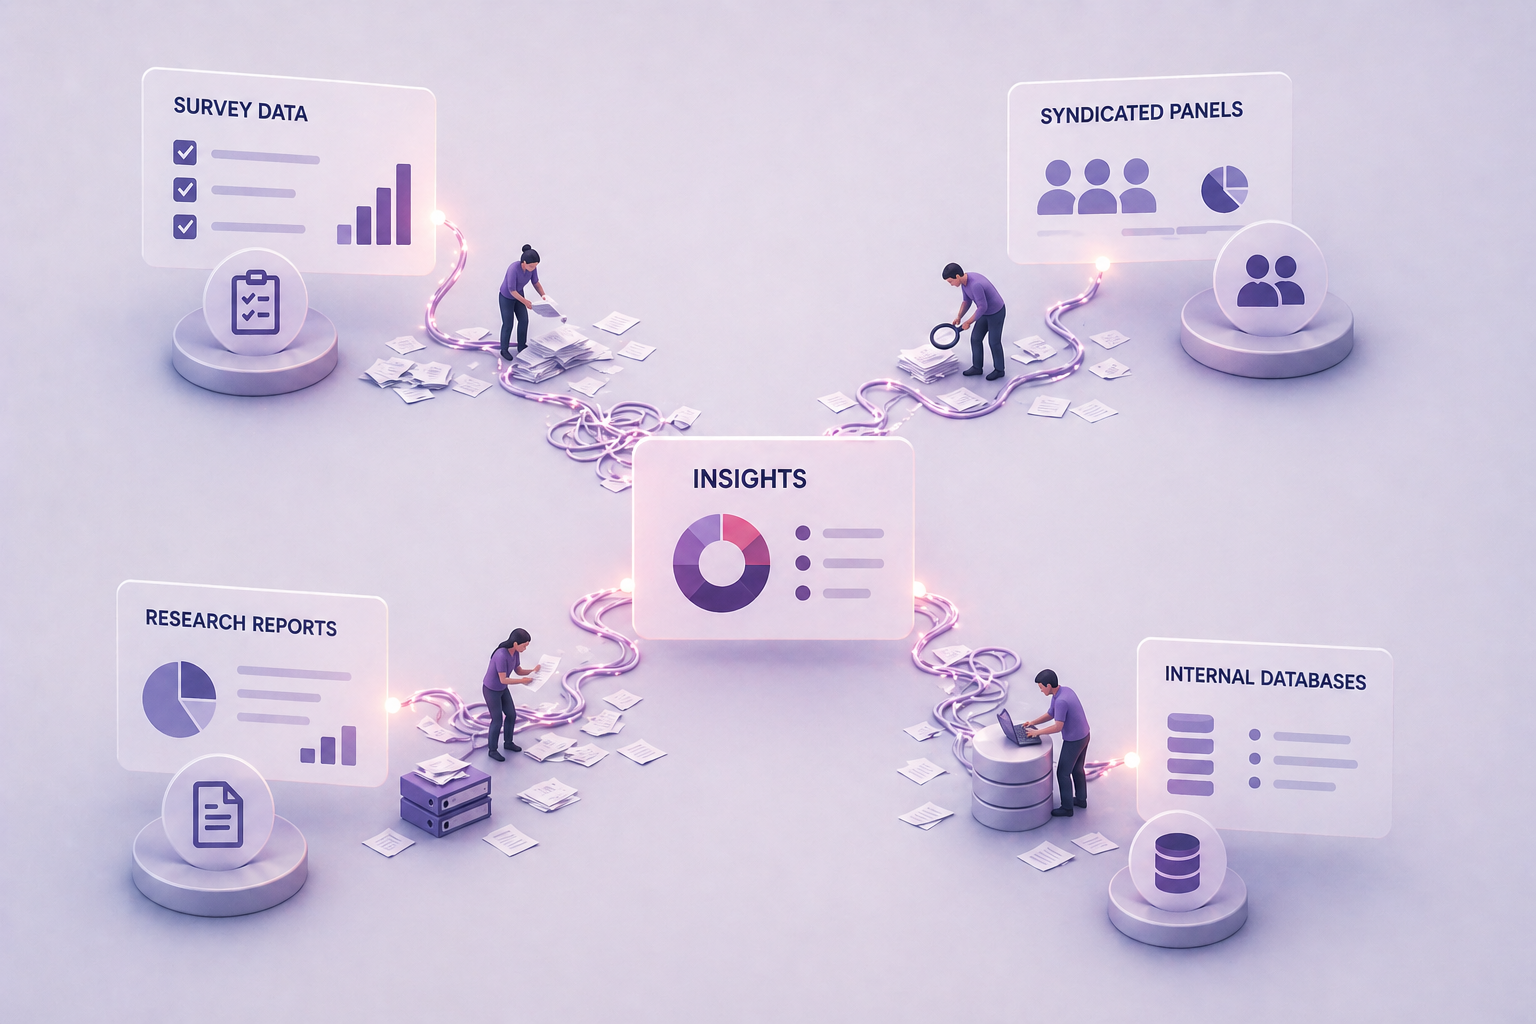
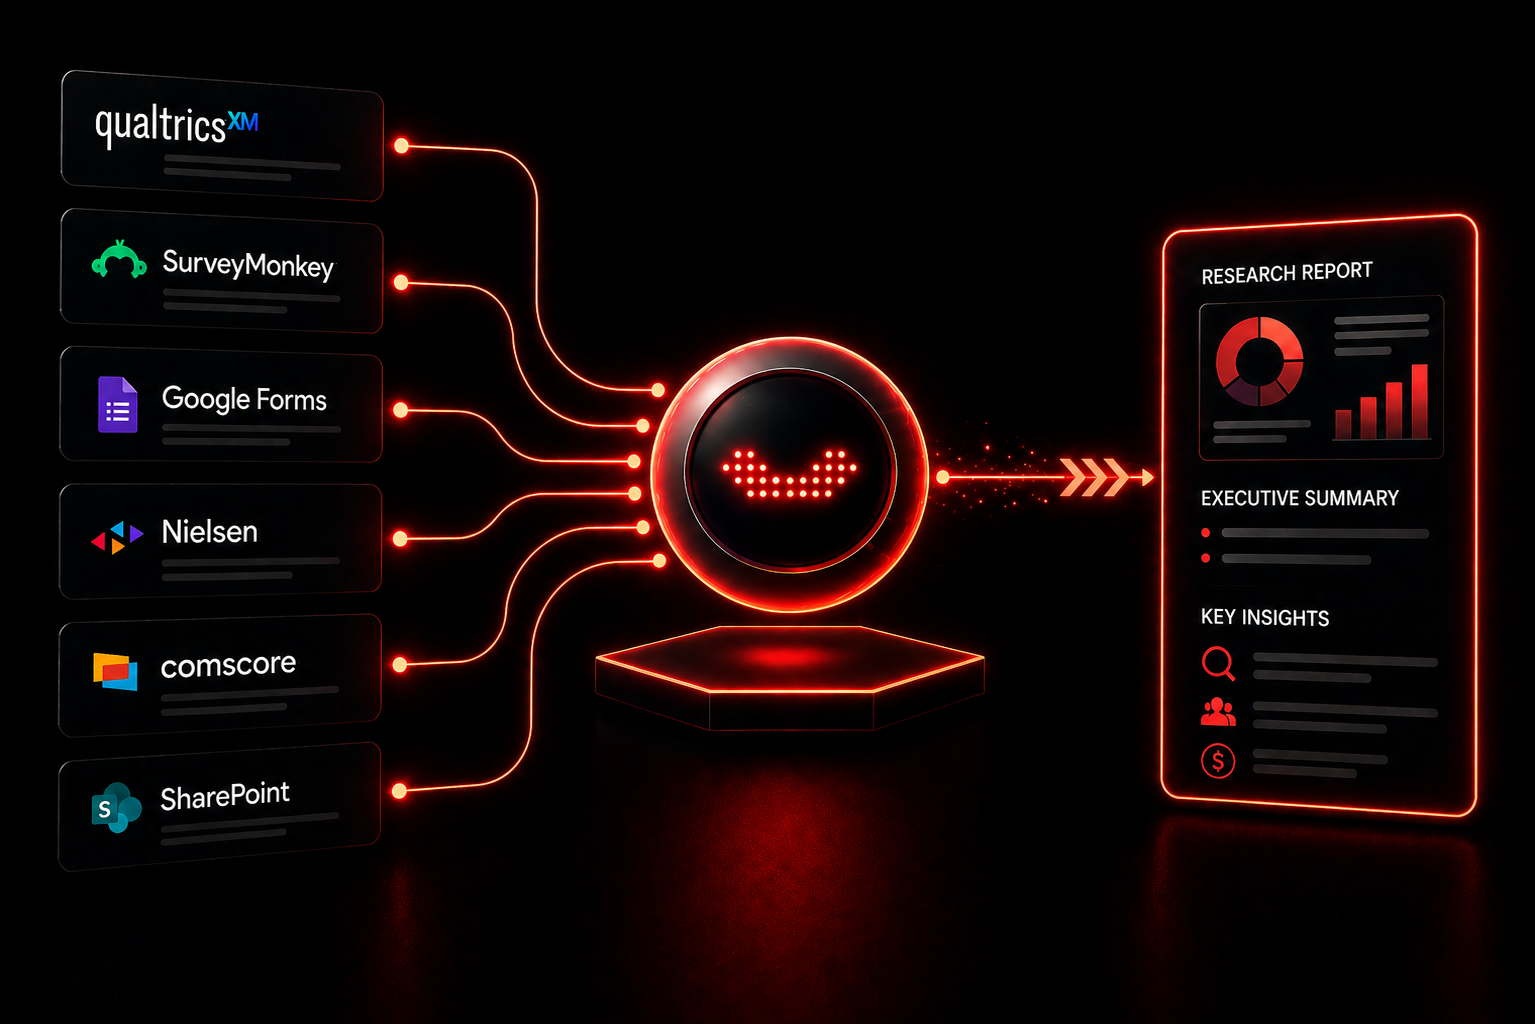
Data assembly eats your calendar
Collecting data from survey tools, syndicated panel sources, research reports, and internal databases takes days before analysis can even begin. Every project starts with the same painful setup.
Deliverables are labor-intensive to produce
Turning analysis into polished client-ready or exec-ready presentations requires hours of formatting, charting, and copy-writing that doesn't require your expertise — but consumes your time anyway.
Scale is limited by headcount
The demand for research and insights always outpaces the team's capacity. Saying no to business units or taking on junior analysts to do repetitive work are your only levers — until now.