For Analytics Teams

From data to decision —
without the week in between.

Redbird automates the repetitive data work that consumes your team's time — so analysts can focus on insight, not data prep.

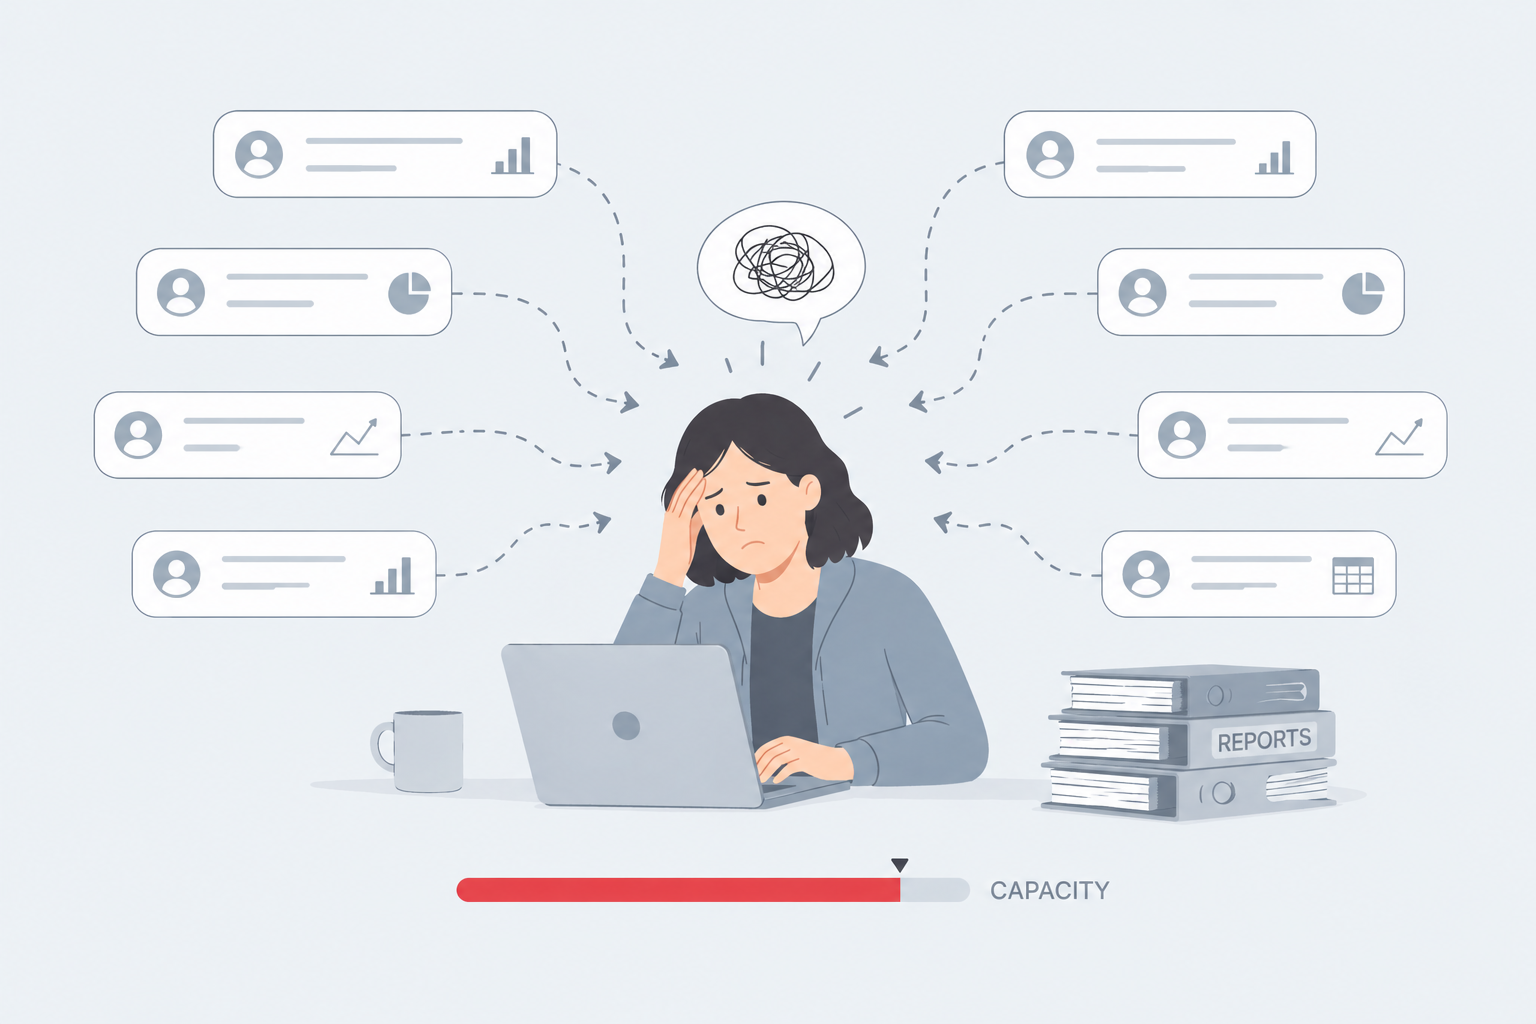
Analytics teams are drowning in requests that they can't scale to meet.

Analytics challenge illustration

Manual grunt work crowds out real analysis

Analysts spend the majority of their time pulling data, cleaning it, and reformatting outputs — not analyzing. Every new stakeholder request means another round of copy-paste.

Repetitive reporting cycles never end

Weekly, monthly, and quarterly reports are rebuilt from scratch every cycle. Minor data source changes break pipelines and delay delivery by days.

You're the bottleneck for the business

Every team in the company wants data faster than your team can deliver it. You can't hire your way out — you need to multiply what your existing analysts can do.

AI automation built for every step of the analytics workflow

Analytics solution illustration
01

Automated data connections

Connect to any data source — cloud warehouses, SaaS tools, spreadsheets, APIs — without writing ETL pipelines. Redbird handles ingestion through natural language instructions.

02

Intelligent data transformation

Clean, join, reshape, and enrich raw data automatically. Describe what you need in plain English; Redbird builds and documents the transformation logic.

03

AI-powered analysis

Run statistical analysis, trend detection, segmentation, and forecasting without SQL or code. Ask questions conversationally and get structured, auditable results.

04

Report generation in any format

Auto-generate polished outputs — PowerPoint decks, Excel workbooks, Word reports, or live web dashboards — directly from the workflow. No copy-paste required.

05

Transparent, auditable steps

Every agent action is logged and visible. Stakeholders can inspect exactly what data was used, how it was transformed, and what logic was applied — building the trust that makes analytics credible.

Common analytics workflows, automated end to end

01

Weekly business performance report

Pull KPIs from your data warehouse, compare against targets, flag anomalies, and publish a formatted executive summary — on a fixed schedule, with zero manual effort.

02

Ad hoc analysis on demand

Answer stakeholder questions ("What drove the Q3 drop in conversion?") through a conversational interface that queries your data, runs the analysis, and returns a structured answer.

03

Cross-source data reconciliation

Automatically join and reconcile data from multiple systems — CRM, warehouse, spreadsheets — surface discrepancies, and deliver a clean merged dataset.

04

Cohort and segmentation analysis

Define customer or user segments in plain language, apply consistent logic across time periods, and generate comparison outputs ready for presentation.

05

Scheduled dashboard refresh

Replace manual dashboard updates with automated data pulls that refresh charts and tables on a set cadence — no BI engineer required.

06

Competitive benchmarking report

Ingest data from multiple external and internal sources, normalize the formats, run comparisons, and produce a structured benchmarking output on demand.

What analytics teams achieve with Redbird

10×
Faster turnaround
Average reduction in time from data request to finished report
80%
Reporting automated
Share of repetitive reporting work that can be automated in the first 30 days
Zero
Lines of code required
Build and run a complete multi-step analytics workflow without writing code
100%
Auditable outputs
Every step logged, every transformation documented, every output explainable

Connects to the data sources and tools your analytics team already uses

Works with every tool your team relies on today — and anything you add tomorrow.

Snowflake BigQuery Redshift Google Sheets Excel Salesforce HubSpot S3 / Cloud Storage Tableau Power BI PowerPoint + any data source

Ready to give your analytics team time back?

Join the other teams already running automated analytics workflows on Redbird.