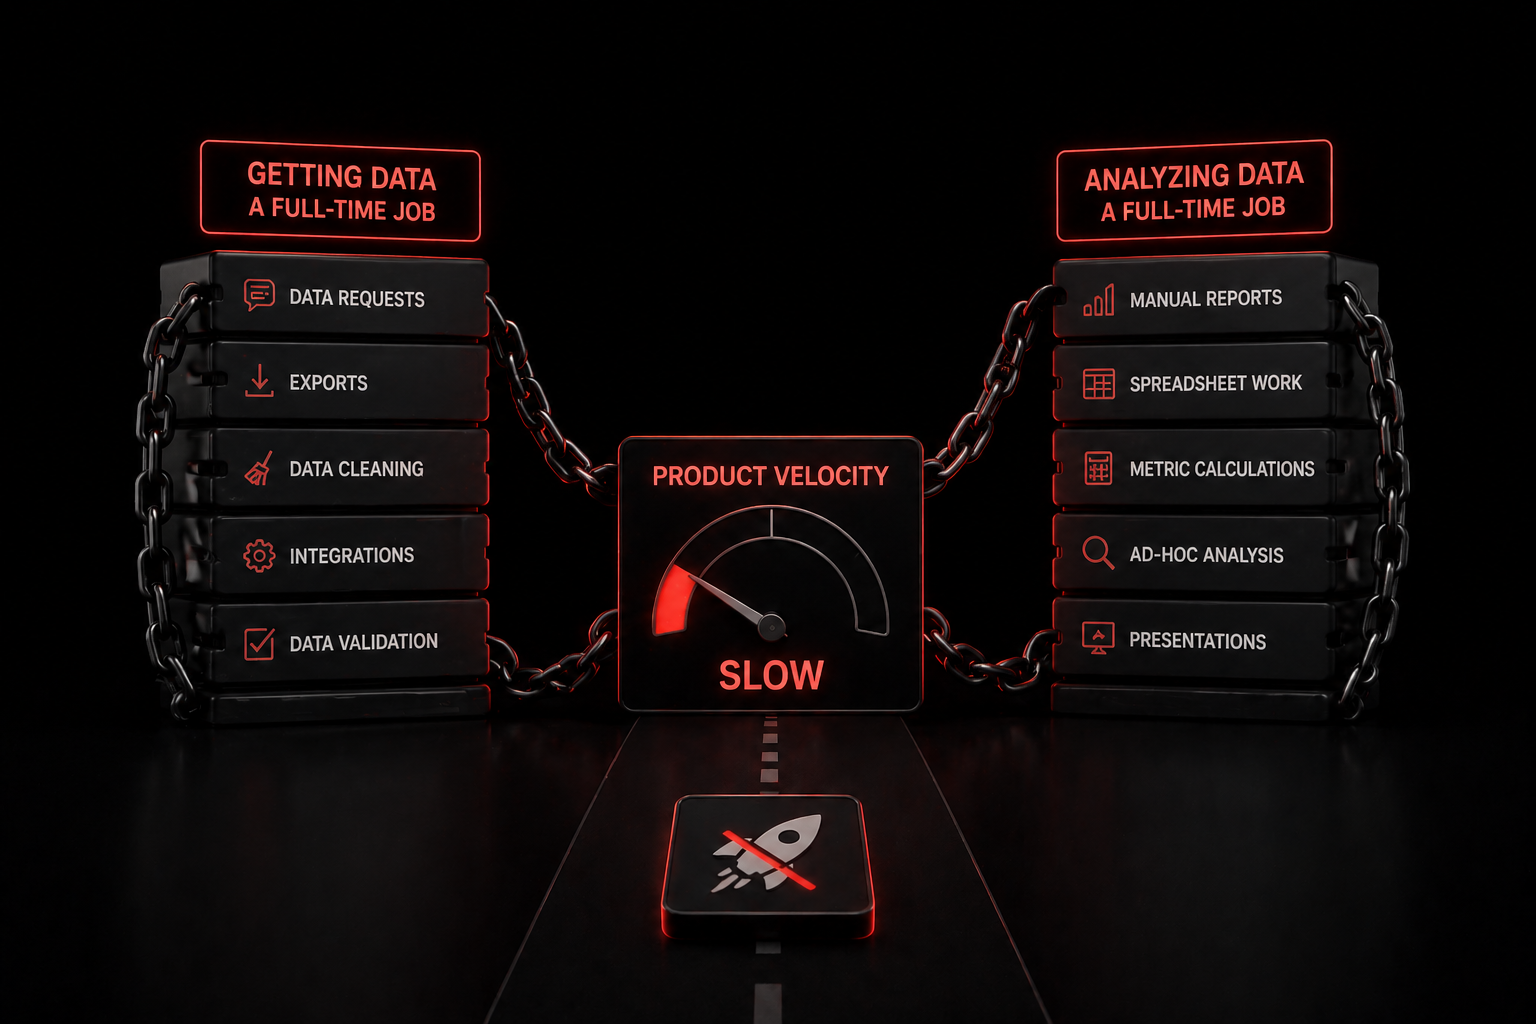
Redbird automates product analytics, user research synthesis, and performance reporting — so product teams spend less time doing analysis and more time making decisions.
Every product question that requires data — funnel analysis, feature adoption, cohort retention — requires a ticket to the data or analytics team. Waiting days for answers slows product decisions that should be made in hours.
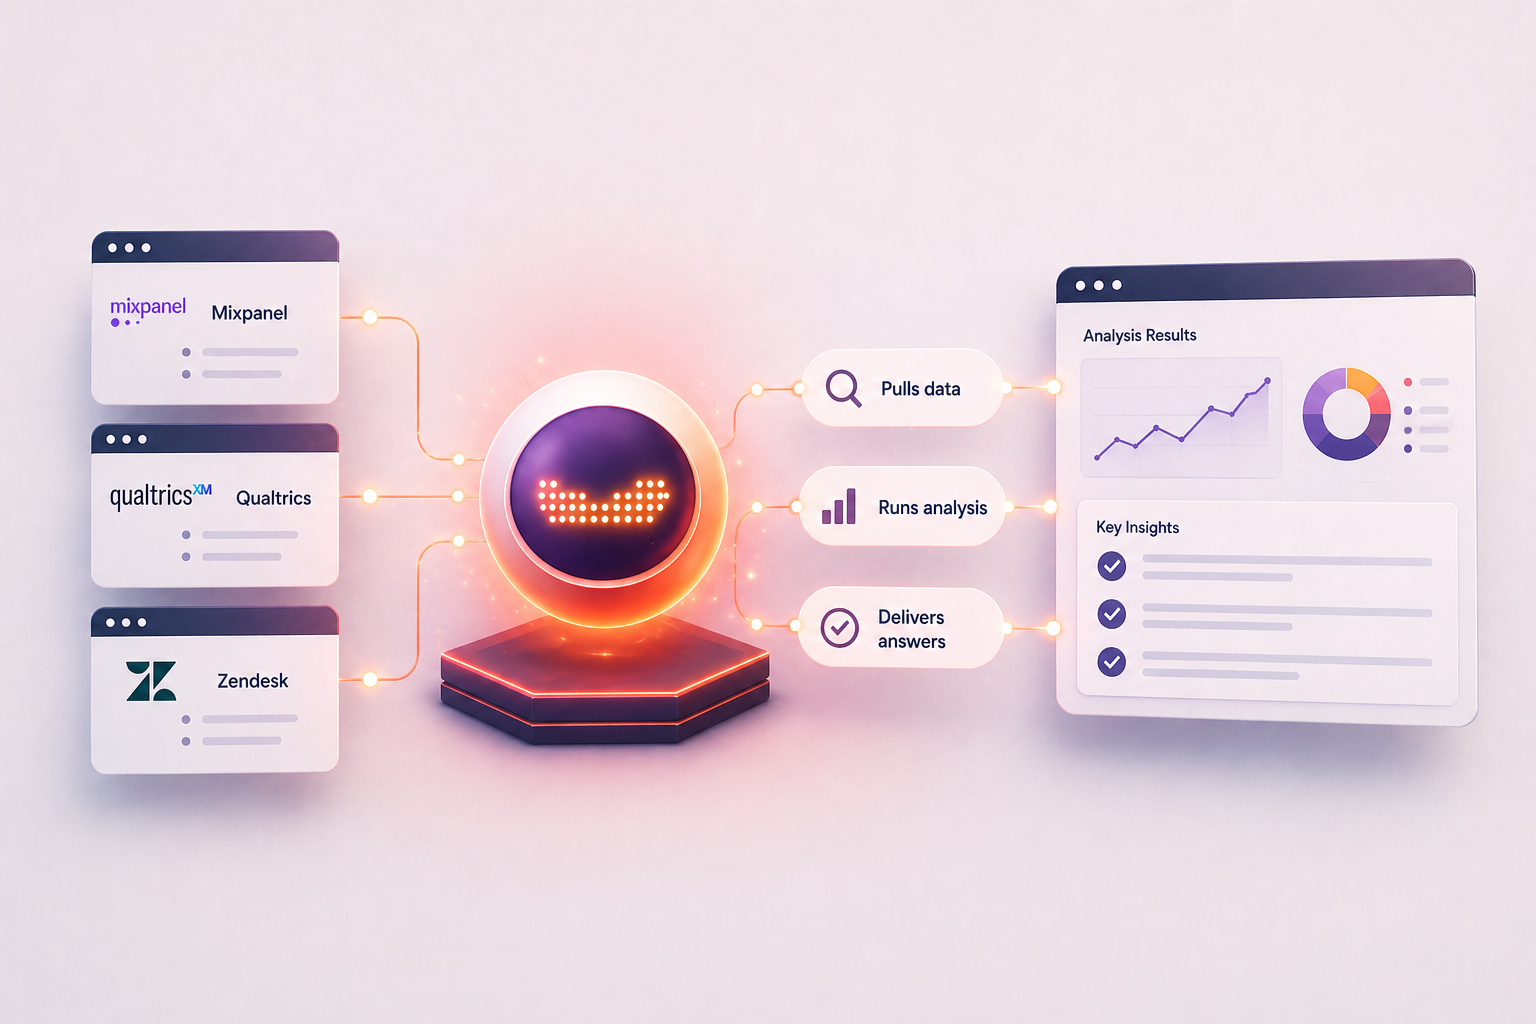
Usage data is in Mixpanel or Amplitude. Survey responses are in a research tool. Support feedback is in Zendesk. Getting a unified view of a user problem requires pulling from all of them manually and synthesizing insights.
Weekly product reviews, sprint retrospectives, and OKR tracking reports are rebuilt from scratch each time — even when the structure is identical and only the data changes.
Connect to Mixpanel, Amplitude, or your analytics platform of choice. Redbird pulls event data, applies funnel and cohort logic, and delivers structured analysis — without writing SQL or waiting on a data team.
Define your funnel steps and cohort logic in plain language. Redbird runs the analysis, applies time-series comparisons, and generates a structured output ready for your product review.
Combine quantitative usage data with qualitative research, NPS comments, and support ticket themes into a unified picture of what users need — assembled automatically.
Generate weekly product performance reports, sprint retrospective data summaries, and OKR progress updates automatically — fresh data, consistent structure, zero manual effort.
Build automated workflows that monitor feature adoption rates, usage trends, and engagement metrics — and surface anomalies or threshold breaches as alerts.
Pull key product KPIs — DAU/MAU, retention, activation rate, feature adoption — from your analytics platform, apply period-over-period comparisons, and generate a formatted weekly product review summary.
Define conversion funnel steps, pull event data, calculate step-by-step conversion rates, and identify the highest-impact drop-off points — delivered as a structured analysis with segment breakdowns.
Pull user cohort data, calculate week-over-week or month-over-month retention curves by acquisition channel or product segment, and generate a retention report with trend analysis.
Automatically pull feature usage data for newly launched features, calculate adoption rates by user segment, and update a feature adoption tracker on a weekly basis.
Ingest NPS survey text, support ticket summaries, and interview notes — apply theme extraction and sentiment analysis — and produce a structured synthesis of key user themes.
Pull metric data for each OKR from the relevant data sources, calculate current progress vs. target, flag off-track OKRs, and generate a formatted OKR status report for leadership review.
Works with every tool your team uses today — and anything you add tomorrow.
Product teams use Redbird to automate data collection, run analytics, synthesize user insights, and make better decisions without waiting in the data request queue.